How Z-Order Cut My Databricks ETL Time in Half
Z-Order cut my Databricks ETL from 1m40s to 50s per tenant. Here's why partitioning failed and how Z-Order works like a clustered index for Delta Lake.


7 min read
I spent years working with SQL Server before moving to Databricks. In SQL Server, clustered indexes are second nature. You define them, the engine physically organizes rows on disk in that order, and your queries fly. When I started building data pipelines in Databricks, I reached for the closest thing I knew: Hive-style partitioning. Partition by tenant, partition by date, split the data into neat directories.
It didn’t work. Not even close.
My daily ETL pipeline processed data across hundreds of tenants, joining multiple tables of around 200GB each with millions of rows. After setting up partitioning, file counts exploded. Performance was sluggish. The whole thing felt wrong for a platform that’s supposed to handle big data effortlessly.
That’s when I discovered Z-Order. It cut my per-tenant processing time from 1 minute 40 seconds to 50 seconds. Here’s what I learned.
The Partitioning Trap
If you come from a traditional data warehouse background, partitioning feels obvious. Pick a column, split the data into directories, and the query engine only reads the directories it needs. Simple.
In Databricks, this instinct often backfires. Here’s why.
Hive-style partitioning creates a separate directory for every distinct value in your partition column. If you partition a table by tenant_id and you have hundreds of tenants, every single write operation creates up to hundreds of new files. Run a daily MERGE or UPDATE, and those file counts multiply fast.
This is the small file problem, and it’s the most common performance killer I’ve seen in Databricks environments. Instead of a manageable number of well-sized Parquet files, you end up with thousands of tiny files. Every query has to open, read metadata from, and scan all of them. The overhead of opening thousands of small files often exceeds the time saved by skipping partitions.
The Databricks documentation itself says it plainly: don’t partition tables under 1 TB, and make sure each partition contains at least 1 GB of data.
Most teams I’ve worked with violate both rules without realizing it.
What Z-Order Actually Does
Z-Order is a data layout optimization technique specific to Delta Lake. When you run OPTIMIZE table_name ZORDER BY (column), Databricks reorganizes your Parquet files. Rows with similar values in the specified column end up in the same files.
Think of it this way. Without Z-Order, if you filter on tenant_id = 42, that tenant’s rows are spread across every file in the table. The engine has to open and scan all of them. After Z-Order, tenant 42’s rows live in just a handful of files. The engine reads the file-level min/max statistics, sees that most files have no data for tenant 42, and skips them entirely.
This is called data skipping (the mechanism that stores minimum and maximum values for each column in every file). Z-Order tightens those ranges so the min/max boundaries don’t overlap across files. More distinct ranges mean more files skipped, which means less data read.
The SQL Server Parallel
If you’ve worked with SQL Server, here’s the mental model that clicked for me:
Z-Order is to Delta Lake what a clustered index is to SQL Server.
A clustered index in SQL Server physically orders rows on disk by the index key. When you query on that key, SQL Server does an index seek instead of a full table scan. It goes straight to the right pages.
Z-Order does the same thing at the file level. It doesn’t order individual rows (Parquet files have their own internal structure), but it ensures that the right rows end up in the right files. At query time, instead of scanning every file, Databricks “seeks” to only the files that contain relevant data.
The granularity is different (row-level vs file-level), but the principle is identical: organize data physically so the engine reads less.
Z-Order vs ORDER BY
A common question: why not just use ORDER BY when writing data?
ORDER BY sorts data linearly on one dimension. If you sort by tenant_id, queries filtering on tenant_id are fast, but queries filtering on date get no benefit.
Z-Order uses a space-filling curve that interleaves multiple dimensions. If you Z-Order by tenant_id and date, queries filtering on either column (or both) benefit from data skipping. It’s multi-dimensional co-locality, not single-column sorting.
That said, Z-Order’s effectiveness degrades as you add more columns. Stick to 1-4 columns max. In my case, one column was enough.
The Fix: One Column, Big Results
Here’s what I actually did.
My pipeline joins several large tables during the daily tenant processing. Each table has a primary key that serves as the join column. I ran:
OPTIMIZE my_table
ZORDER BY (primary_key_column)
That’s it. One command per table. I Z-Ordered each table on its primary key (the column used in joins), and I dropped Hive-style partitioning entirely.
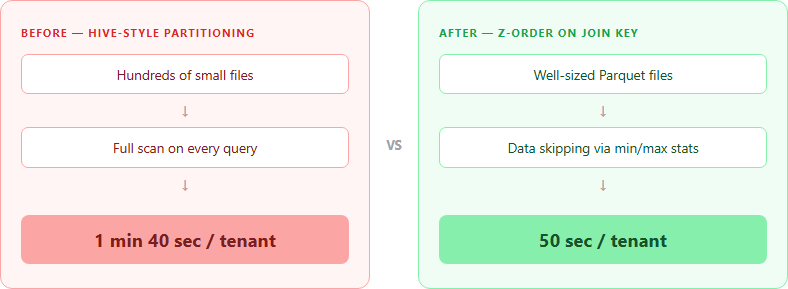
The results:
| Metric | Before (Partitioned) | After (Z-Ordered) |
|---|---|---|
| Per-tenant processing | 1 min 40 sec | 50 sec |
| File layout | Thousands of small files | Manageable, well-sized files |
| Maintenance | Constant small file cleanup | Periodic OPTIMIZE runs |
50% reduction in processing time. Across hundreds of tenants running daily, that adds up fast.
The key insight: Z-Order on the join column gives you the biggest win. When Databricks processes a join, it reads both sides. If both tables are Z-Ordered on the join key, the engine skips files on both sides of the join. It’s like having a clustered index on both tables in SQL Server.
Important Caveats
Z-Order isn’t a magic bullet. A few things to keep in mind:
Z-Order degrades over time. INSERT, UPDATE, and DELETE operations write new files that aren’t Z-Ordered. You need to run OPTIMIZE ... ZORDER BY periodically to maintain the layout. I run it daily as part of my ETL pipeline, right after the data load completes.
Statistics must exist for your Z-Order columns. By default, Delta Lake collects min/max statistics on the first 32 columns in your table schema for external tables. Unity Catalog managed tables handle this differently via predictive optimization. If your Z-Order column isn’t covered by statistics, data skipping won’t work and you’ve wasted compute. Check your table’s column order or explicitly configure delta.dataSkippingStatsColumns.
More columns means less effectiveness. Each additional column in the ZORDER BY clause dilutes the locality benefit. If you Z-Order by four columns, no single column will be as tightly clustered as if you’d Z-Ordered by just one. Be deliberate about which columns you choose.
OPTIMIZE is CPU-intensive. The Z-Ordering operation itself consumes compute. Databricks recommends using compute-optimized instances with attached SSDs. Schedule it during off-peak hours if your cluster is shared.
When Partitioning Still Makes Sense
I’m not saying partitioning is useless. It has valid use cases: low-cardinality columns (like year or region) on tables well over 1 TB, where each partition holds at least 1 GB of data. Classic time-based ingestion patterns work fine with partitioning.
But that’s a different article. The point here is simple: if your instinct is to partition a Databricks table the same way you’d partition a SQL Server table, stop and consider Z-Order first.
A Word on Liquid Clustering
You might have seen Databricks recommending Liquid Clustering as the replacement for both partitioning and Z-Order. It’s generally available since Runtime 15.2, and it’s worth knowing about.
Liquid Clustering is adaptive. It automatically organizes data into optimal file clusters. You can change the clustering keys without rewriting existing data, and it handles incremental updates without the “Z-Order degrades over time” problem.
It’s the direction Databricks is heading, and I’m keeping an eye on it. But Z-Order is what I know, what I’ve tested in production, and what delivered measurable results for my team. When I have a solid Liquid Clustering story to tell, I’ll write that article too.
Wrapping Up
Coming from SQL Server, I expected Databricks to have something like clustered indexes. It does. It’s called Z-Order. The packaging is different (it’s a file-level optimization, not a row-level one), but the principle is the same: organize your data so the engine reads less.
If you’re running ETL across large tables and your first move was to partition everything, take a step back. Drop the partitions, Z-Order on your join keys, and measure the difference. For my pipeline, it was the difference between 1 minute 40 seconds and 50 seconds per tenant, across hundreds of tenants, every single day.
Sometimes the simplest optimization is the one that sticks.
If you found this useful, follow me for more on data engineering in the Databricks ecosystem.