KEDA Didn't Just Save Us Money. It Saved Our Jobs From Themselves.
How we stopped AKS PDF workers from OOM-crashing using KEDA scale to zero, a dedicated high-memory node pool, and a Postgres queue trigger. (142 chars)

Our PDF workers were crashing mid-job because the nodes didn't have enough memory to finish the work. We moved them to a dedicated high-memory pool. KEDA scales that pool to zero between jobs, so you only pay while work is actually running.
The cost savings came later. The problem we were actually solving was that our PDF queue workers kept dying before they could finish.
We were generating large, complex PDFs — the kind that require holding significant document structure in memory while rendering, paginating, and assembling the final output. On our standard AKS nodes, this worked fine in development. Under stress test, it fell apart. OOM exceptions. Pods crashing mid-job. When a job did complete, it took 40 minutes.
The workload was not broken. The infrastructure was wrong for it.
The Root Cause Was Node Fit, Not Code Quality
When a pod gets OOM-killed, the instinct is to look at the application. Tune the renderer. Stream the output. Reduce allocations. We did some of that. It helped at the margins. The core issue remained: our standard nodes did not have enough memory headroom to safely complete a large PDF generation job under concurrent load.
The answer was not to fix the code further. The answer was to give the job the compute it actually needed, for exactly as long as it needed it.
That is a resource allocation problem. And it is one that Kubernetes was not designed to solve on its own.
What KEDA Made Possible
We evaluated Service Bus. Priority ordering and mid-queue cancellation both require external state management that negates most of what a managed broker gives you. Postgres already owns that state. The trigger was a natural fit.
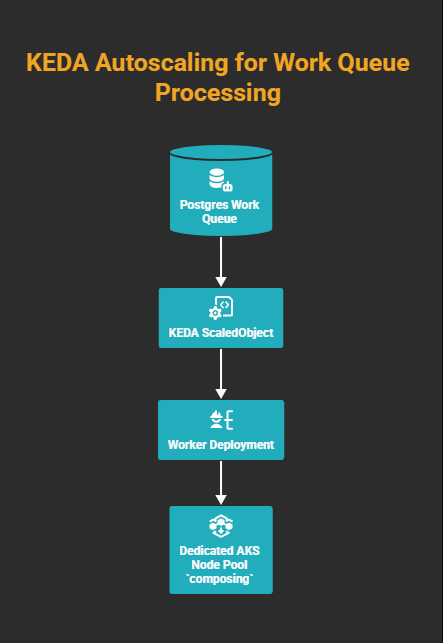
KEDA (Kubernetes Event-Driven Autoscaler) watches an external event source and adjusts replica counts in response. In our case, that source was a Postgres table acting as a prioritized work queue. When rows appeared, KEDA scaled up worker Deployments. When the queue drained, it scaled them back to zero.
That is the standard pitch. Here is what made it interesting for us.
Because KEDA controls when pods spin up and spin down, it gave us a clean seam to insert something else: a dedicated high-memory node pool that only runs when the queue has work, and sits at zero cost when it does not.
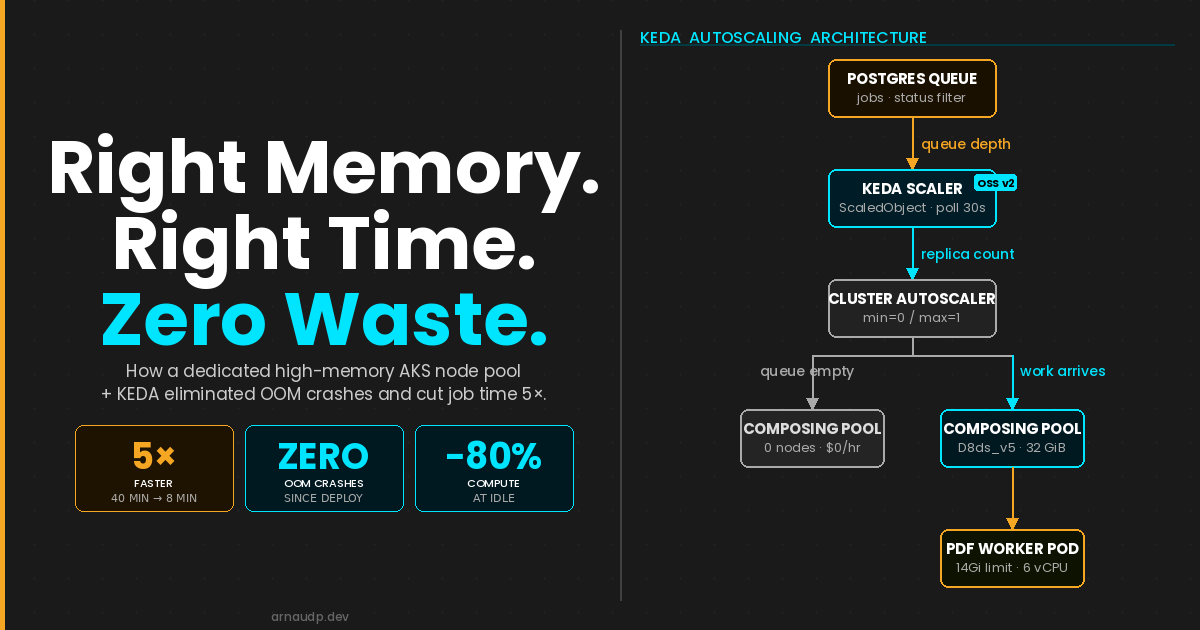
The architecture looks like this:
KEDA ties queue depth to replica count; the cluster autoscaler ties replica count to node count. No pending work means zero replicas means zero nodes; you pay only while the queue is non-empty.
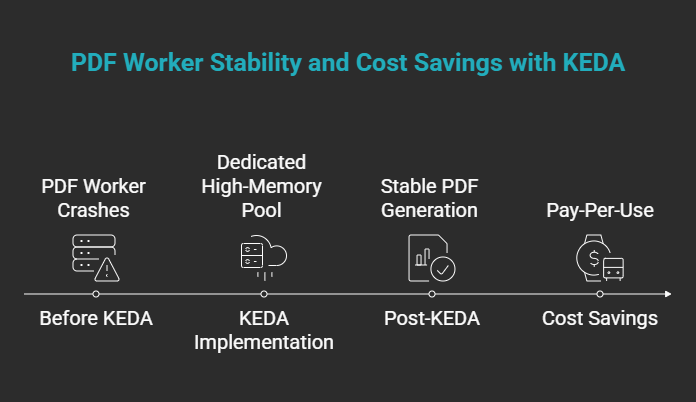
The Before and After
KEDA is what made that memory economically viable to provide.
The 40-to-8-minute improvement is not a KEDA win. It is a memory and CPU win. On standard nodes the job was competing for both. On the Standard_D8ds_v5 (8 vCPU), the pod gets 7 effective cores (1 reserved for the node's health probe) and the full memory it needs. No GC thrashing, no swapping, no retries. The renderer does what it was always capable of doing.
The KEDA ScaledObject
The scaler reads from the Postgres queue. The SQL query returns queue depth (status filters, job-type filters, or both, depending on how you model work). We ship the ScaledObject from Helm so polling, cooldown, and replica bounds stay in values.yaml.
Postgres credentials are not inlined in the trigger: we use a TriggerAuthentication object so the scaler can connect without stuffing secrets into the ScaledObject spec. The connection string comes from a Kubernetes secret backed by Azure Key Vault; secretName and secretKey in values tell the chart which AKV-sourced secret to reference.
values.yaml holds the knobs; flip keda.enabled off when you want a static replica count (for example local dev).
# KEDA autoscaling: scales deployment 0↔1 based on PostgreSQL job queue depth.
# Set keda.enabled=false to use static replicaCount instead (e.g. local dev).
keda:
  enabled: true
  pollingInterval: 30
  cooldownPeriod: 300
  minReplicaCount: 0
  maxReplicaCount: 1
  query: "SELECT COUNT(*) FROM jobs WHERE status IN ('Queued', 'Running')"
  targetQueryValue: "1"
  secretName: <your-akv-synced-secret>
  secretKey: keda_pg_connection
The chart renders both the TriggerAuthentication and the ScaledObject from those values:
{{- if .Values.keda.enabled }}
apiVersion: keda.sh/v1alpha1
kind: TriggerAuthentication
metadata:
  name: {{ .Release.Name }}-pg-auth
spec:
  secretTargetRef:
    - parameter: connection
      name: {{ .Values.keda.secretName }}
      key: {{ .Values.keda.secretKey }}
{{- end }}
{{- if .Values.keda.enabled }}
apiVersion: keda.sh/v1alpha1
kind: ScaledObject
metadata:
  name: {{ .Release.Name }}
spec:
  scaleTargetRef:
    name: {{ .Release.Name }}
  pollingInterval: {{ .Values.keda.pollingInterval }}
  cooldownPeriod: {{ .Values.keda.cooldownPeriod }}
  minReplicaCount: {{ .Values.keda.minReplicaCount }}
  maxReplicaCount: {{ .Values.keda.maxReplicaCount }}
  triggers:
    - type: postgresql
      metadata:
        query: {{ .Values.keda.query | quote }}
        targetQueryValue: {{ .Values.keda.targetQueryValue | quote }}
      authenticationRef:
        name: {{ .Release.Name }}-pg-auth
{{- end }}
minReplicaCount: 0 is the key setting. When the queue is empty, the Deployment scales to zero. With nothing running on the dedicated pool, the cluster autoscaler removes the nodes. The dedicated infrastructure sits dormant until the queue has work.
maxReplicaCount: 1 matches how we cap this workload (one replica, one composing node in the pool). If you need more throughput, raise the cap and size the node pool accordingly.
Set cooldownPeriod slightly above your p95 job duration so KEDA does not decide the queue is idle while work is still finishing (300 seconds here; adjust to your workload).
The Node Pool Configuration
In AKS, this means a separate user node pool with enough RAM for the job, tainted so nothing else schedules there. We set cluster autoscaler min to zero so the pool can drain completely when idle. We define ours in Terraform (pool name composing; SKU Standard_D8ds_v5, 8 vCPU and 32 GiB; autoscaler min=0, max=1 for our case).
# Dedicated AKS node pool for the composing worker
#
# Standard_D8ds_v5 (8 vCPU, 32 GiB) with cluster autoscaler min=0 / max=1.
# Tainted so only pods with a matching toleration schedule here; the cluster
# autoscaler can safely drain and deallocate the node when idle.
# ---------------------------------------------------------------------------

resource "azurerm_kubernetes_cluster_node_pool" "composing" {
  name                  = "composing"
  kubernetes_cluster_id = data.azurerm_kubernetes_cluster.main.id
  vm_size               = var.composing_node_pool_vm_size
  os_type               = "Linux"

  # Cluster autoscaler: scale to zero when idle, max one node
  enable_auto_scaling   = true
  min_count             = var.composing_node_pool_min_count
  max_count             = var.composing_node_pool_max_count

  # Labels used by nodeSelector in the Helm deployment
  node_labels = {
    "agentpool" = "composing"
  }

  # Taint to prevent non-composing workloads from scheduling here
  node_taints = ["composing=true:NoSchedule"]
}
The NoSchedule taint ensures nothing accidentally lands on this pool. The worker pod declares a matching toleration, pins to the pool with nodeSelector, and requests the memory it actually needs:
tolerations:
  - key: "composing"
    operator: "Equal"
    value: "true"
    effect: "NoSchedule"
nodeSelector:
  agentpool: composing
resources:
  requests:
    memory: "12Gi"
    cpu: "4"
  limits:
    memory: "14Gi"
    cpu: "6"
Standard nodes couldn't schedule a 12Gi memory request; this pod simply would not have landed. On the Standard_D8ds_v5 pool it lands cleanly.
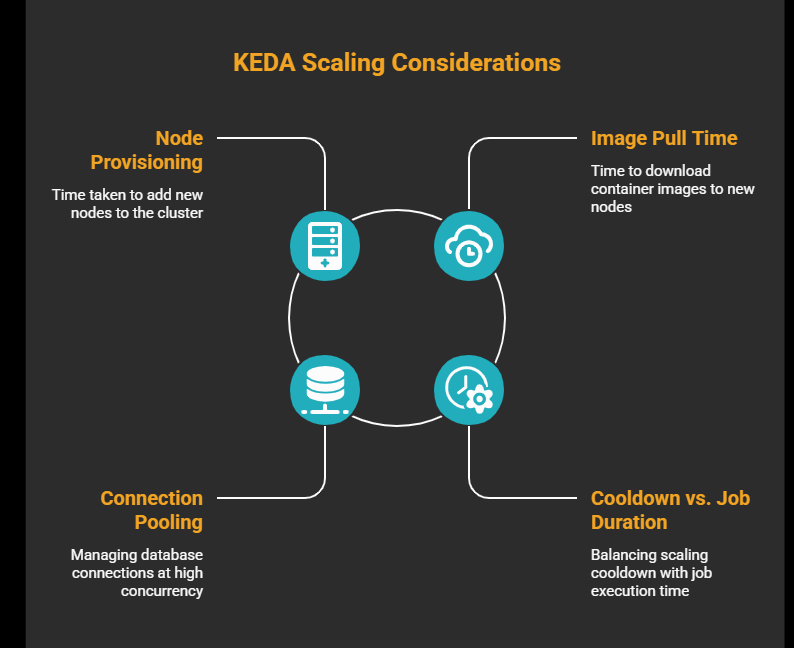
What to Watch For
Node provisioning latency. When scaling from zero, the cluster autoscaler needs to provision a new node before your pod can be scheduled. On AKS, this typically takes 60–90 seconds. If your queue is latency-sensitive, keep minReplicaCount: 1 to hold one pod (and therefore one node) warm. You pay for one node continuously but eliminate cold-start delay.
Image pull time. A freshly provisioned node has no image cache. If your worker image is large, factor pull time into your end-to-end latency. Use Azure Container Registry with the node pool's managed identity to avoid authentication delays.
Connection pooling. KEDA queries Postgres every pollingInterval seconds. Your workers also hold queue connections. At low replica counts this is trivial; at higher concurrency, verify you are within your database connection limit.
Cooldown vs. job duration. The query above counts both Queued and Running rows, and that matters. If you only count Queued, the moment a worker picks up a job and flips its status to Running, the count drops to zero and KEDA starts the cooldown clock. If the job outlasts the cooldown, KEDA scales to zero, Kubernetes sends SIGTERM, and if terminationGracePeriodSeconds runs out before the job finishes, the pod gets SIGKILL mid-job. Include Running in the query. Set terminationGracePeriodSeconds above your p95 job duration as a second line of defence.
The Takeaway
We were not looking for a cost optimization. We were looking for a way to stop our jobs from crashing. KEDA gave us the mechanism to afford the right infrastructure, because it would only exist while the queue had work.
The OOM exceptions stopped. Job time dropped from 40 minutes to 8. And because the high-memory nodes are fully dormant outside of active job execution, the compute bill for this workload decreased by more than 80%.
That is what happens when you match infrastructure to workload instead of forcing the workload to fit the infrastructure you already have.