Why Your SQL Server View Is Slow (And How an Inline TVF Fixes It)
SQL Server views can hide an expensive GROUP BY boundary. Here's the diagnosis and how an inline TVF brought a 3-minute query to 4 seconds.

The query had been running fine for months. It pulled ad performance summaries by dealer: counts, impressions, nothing exotic. Then one morning it stopped finishing. Timeout after timeout, and nobody had changed the code.
What had changed was the data. AdEvents had grown from a few hundred thousand rows to north of eight million, silently crossing the threshold where this particular query design stops working.
I checked the view. The logic looked correct. I added a non-clustered index on the filter column. No change.
I updated statistics. Still slow. At that point, the indexes were fine and the query was logically right, which left one thing to check: the execution plan.
I ran it with "Include Actual Execution Plan" turned on. The plan told the whole story in about five seconds.
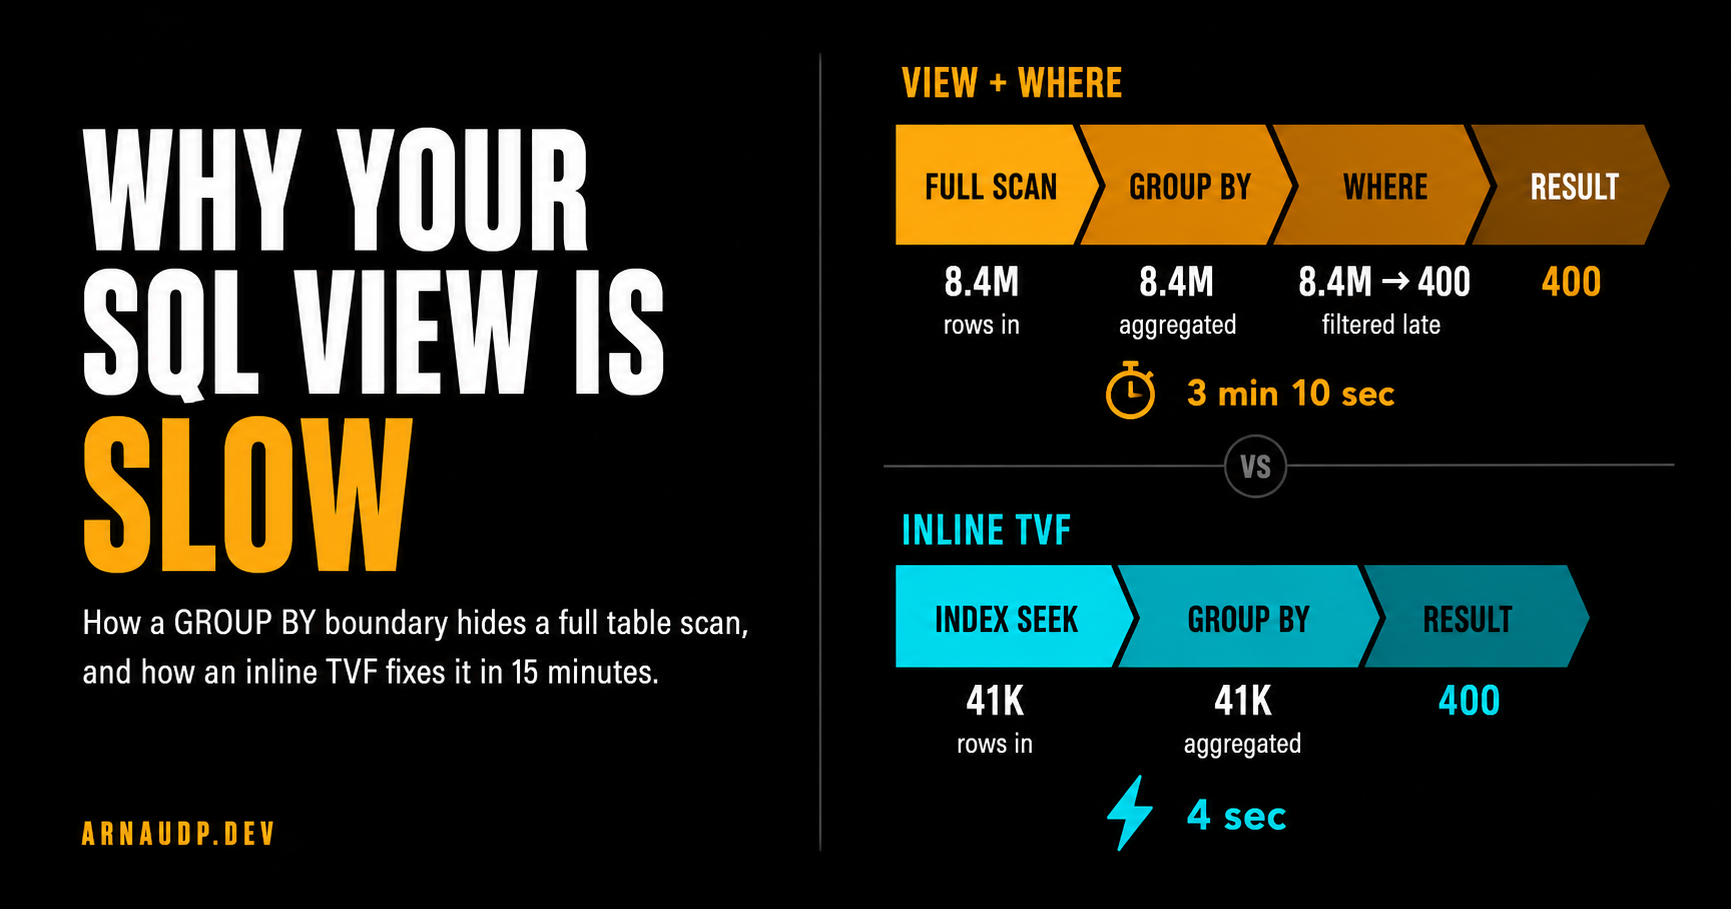
In this plan, the engine was scanning 8.4 million rows, hashing them all into a GROUP BY aggregate, and then applying my WHERE clause. By the time the filter ran, the work was already done. I was throwing away 99.5% of the rows, after paying to aggregate all of them.
Fifteen minutes to fix. Longer to figure out why. That's what this article is about.
What a View Actually Does
People often think of views as shortcuts. But a view is just a named query: no pre-computation, no cache, no magic. The optimizer expands it into the calling query during optimization.
That expansion is normally a good thing. SQL Server is smart enough to push your WHERE clause down through joins, subqueries, and simple projections. Predicate pushdown is the optimizer shoving filters as close to the data as it can. The working set shrinks before the expensive operations run.
That part matters. SQL Server is not blindly running the view first and your query second. The problem starts when the actual execution plan shows that the filter stayed outside an expensive aggregate.
But certain operators can't give you any output until they've seen all the input. The most common ones in reporting views are:
- GROUP BY and aggregate functions
- DISTINCT
- Window functions like
ROW_NUMBER()orRANK() - TOP N inside a subquery or view
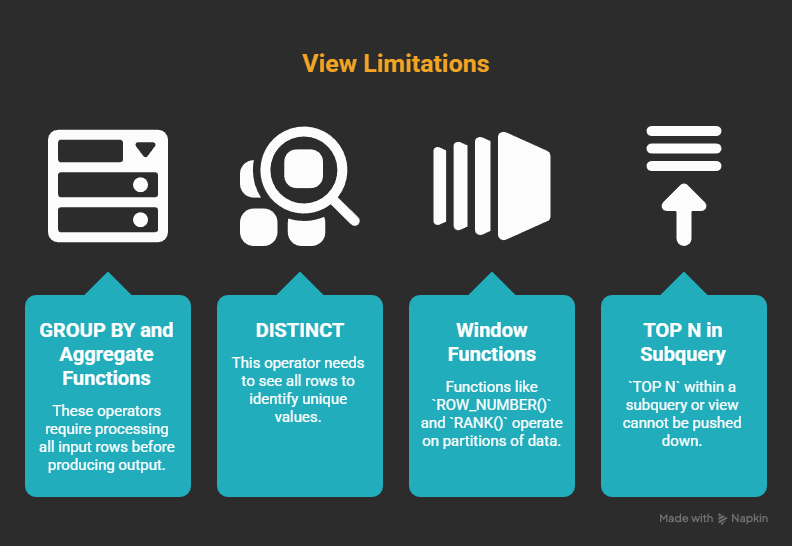
What ties them together: the operator may need to process a large input before it can produce the result you care about. The result row count changes, and that can limit how freely the optimizer can move predicates around.
Sometimes SQL Server can push an outer filter below an aggregate, especially when the filter is on a grouping key.
But it cannot always do that. Joins, expressions, DISTINCT, window functions, TOP, type conversions, and other query shape details can stop or complicate that rewrite.
When the actual plan shows the filter after the aggregate, the abstraction has put the expensive work on the wrong side of the filter. If you've got 10 million rows and you're filtering to one dealer, that can mean aggregating 10 million rows to get back 400.
The optimizer is doing the right thing: it won't push your filter if that would change the answer. The problem is that your view design put the expensive operation on the wrong side of that boundary.
The Actual Query
Here's the view from production (anonymized):
CREATE VIEW vw_DealerAdSummary AS
SELECT
    DealerId,
    AdType,
    COUNT(DISTINCT AdId)   AS UniqueAds,
    SUM(Impressions)       AS TotalImpressions
FROM AdEvents
GROUP BY DealerId, AdType;
And how it was called:
SELECT *
FROM vw_DealerAdSummary
WHERE DealerId = 42;
Looks reasonable. And in a simple case where the filter is on a GROUP BY key, SQL Server may be able to push that predicate down.
But that is not what happened in this production plan. Here's what SQL Server actually did:
- Scan the full
AdEventstable - Hash aggregate every row by
DealerIdandAdType - Apply
WHERE DealerId = 42to the result
At 10,000 rows, that's fine. You don't notice. At 10 million rows, step 2 is the problem. The plan was aggregating rows for every dealer in the system, then discarding everything except one. The GROUP BY had become the boundary, and the WHERE clause was on the wrong side of it.
The index I added earlier? It did not help this plan. The bottleneck wasn't storage access anymore. It was the logical work of aggregating millions of rows before the selective predicate reduced the working set.
The Fix: Inline Table-Valued Function
The solution was to make the selective key part of the query shape before the aggregation. The way to do that with a parameterized query is an inline table-valued function (inline TVF):
CREATE FUNCTION fn_DealerAdSummary (@DealerId INT)
RETURNS TABLE AS RETURN
(
    SELECT
        DealerId,
        AdType,
        COUNT(DISTINCT AdId)   AS UniqueAds,
        SUM(Impressions)       AS TotalImpressions
    FROM AdEvents
    WHERE DealerId = @DealerId
    GROUP BY DealerId, AdType
);
Called as:
SELECT *
FROM fn_DealerAdSummary(42);
What changed: the WHERE DealerId = @DealerId is now inside the function body, before the GROUP BY. In this plan, SQL Server only aggregates rows for dealer 42. The working set collapses before the hash aggregate runs.
The execution plan changes completely. Instead of a full table scan feeding a hash aggregate, I got an index seek on DealerId feeding a much smaller aggregate. Before: 8.4 million rows into the hash. After: 41,000 rows. That index I added earlier? It now actually does something. The aggregation boundary was never only an index problem. Once the filter is inside the function, the optimizer can use the index to reach just the rows for that dealer before any aggregation happens.
Why This Works: How the Optimizer Sees Inline TVFs
Think of an inline TVF as a parameterized view. It's not a stored procedure, and it's not a multi-statement TVF. SQL Server expands the function body into the calling query before optimization, so its SELECT becomes part of the outer query tree.
When that happens, the @DealerId parameter is already inside the WHERE clause of the inlined SELECT. The optimizer sees it as a filter on AdEvents.DealerId, not as an outer filter slapped on after aggregation. It can seek directly to the rows for that dealer, aggregate only those, and return.
The split that matters: inline vs multi-statement TVFs. A multi-statement TVF looks like this:
-- DON'T use this for performance-sensitive queries
CREATE FUNCTION fn_DealerAdSummary_SLOW (@DealerId INT)
RETURNS @result TABLE (DealerId INT, AdType VARCHAR(50), UniqueAds INT, TotalImpressions BIGINT)
AS
BEGIN
    INSERT INTO @result
    SELECT DealerId, AdType, COUNT(DISTINCT AdId), SUM(Impressions)
    FROM AdEvents
    WHERE DealerId = @DealerId
    GROUP BY DealerId, AdType;
    RETURN;
END;
A multi-statement TVF is a black box. The optimizer can't look inside it. It materializes the result into a table variable with no statistics, usually assumes it returns 1 or 100 rows regardless of reality, and generates a bad plan for any query that joins or filters against that result.
When someone says "functions are slow in SQL Server," they usually mean multi-statement TVFs. They're opaque to the optimizer, cardinality guesses are off, and the plans get grim. Inline TVFs don't have that problem.
Quick way to tell them apart: an inline TVF is a single RETURNS TABLE AS RETURN (SELECT …) with no BEGIN/END and no RETURNS @variable TABLE (…). If you see BEGIN/END and a table-typed return variable, that's multi-statement. I don't use those on a hot query path.
The Numbers
The before and after from this specific production case:
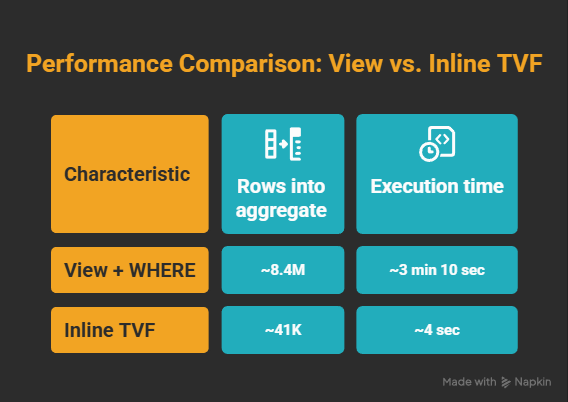
The gain depends on how selective your parameter is. If you're filtering to a dealer with 5% of all rows, the win is real but smaller. If you're filtering to a dealer with 0.5% of all rows (as here), it's dramatic. The more selective, the bigger the swing.
When to Use a View vs an Inline TVF
Not every view should become an inline TVF.
Views aren't wrong. I still use them for join abstractions, computed columns, and anything that stays cheap enough at full-scan scale.
The mistake is reaching for a view by reflex when you have a known filter key. If every caller always filters by DealerId, or CustomerId, or TenantId, ask yourself: why are you aggregating all dealers to get back one? That's the question the execution plan eventually forces you to ask.
The Audit
The hard part wasn't the fix. Nothing in the code looked wrong. The view was correct. The query was correct. The indexes were fine.
SQL Server was doing exactly what this plan asked it to do: aggregate everything, then filter.
A query can do the wrong amount of work and still return the right rows. The text of the query won't tell you how much extra work SQL Server signed up for. The plan does.
Once you know what to look for, it takes about 30 seconds to spot. If you have a view that contains GROUP BY, DISTINCT, a window function, or TOP, and every caller filters by a specific key, you have a candidate. The optimizer may be able to help, but do not assume it did. Check whether the actual plan applies the filter before or after the expensive operation.
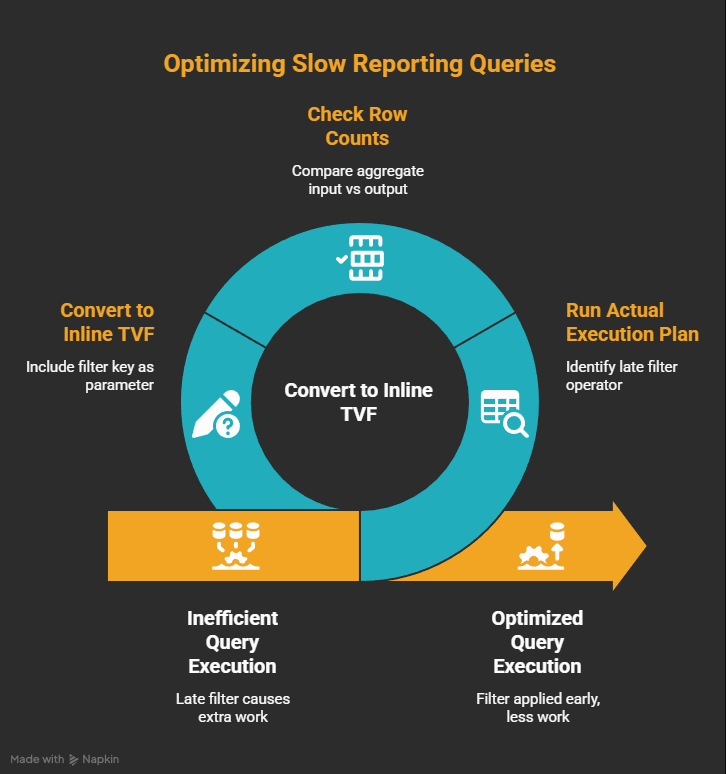
Here's the audit I now run on any slow reporting query:
- Run the Actual Execution Plan (not estimated: actual). Look for a Filter operator sitting after a Hash Match or Stream Aggregate.
- Check the row counts at the aggregate input versus the rows you actually need. If 8 million go in and the caller needs one dealer, you found the shape.
- Move the selective filter inside the abstraction, often with an inline TVF. Re-run the plan. The aggregate input should now be much closer to the rows needed for that key.
One more shortcut: if execution plans feel intimidating to read cold, paste the XML into an LLM. In SSMS, right-click the plan and choose "Save Execution Plan As…" or copy the XML directly. Ask it: "Which operators are expensive, and why is the filter applying late?" Redact table and column names first. It's no substitute for learning to read plans, but it buys you clarity when you're under pressure.
Once you've seen this pattern once, the next one takes about five minutes.
If you build systems at scale and want more like this, I write about execution plans, T-SQL internals, and architecture decisions that actually matter in production at Architect's Notebook. Follow if this saved you time, or share it with the person on your team who's still adding indexes hoping the query gets faster.